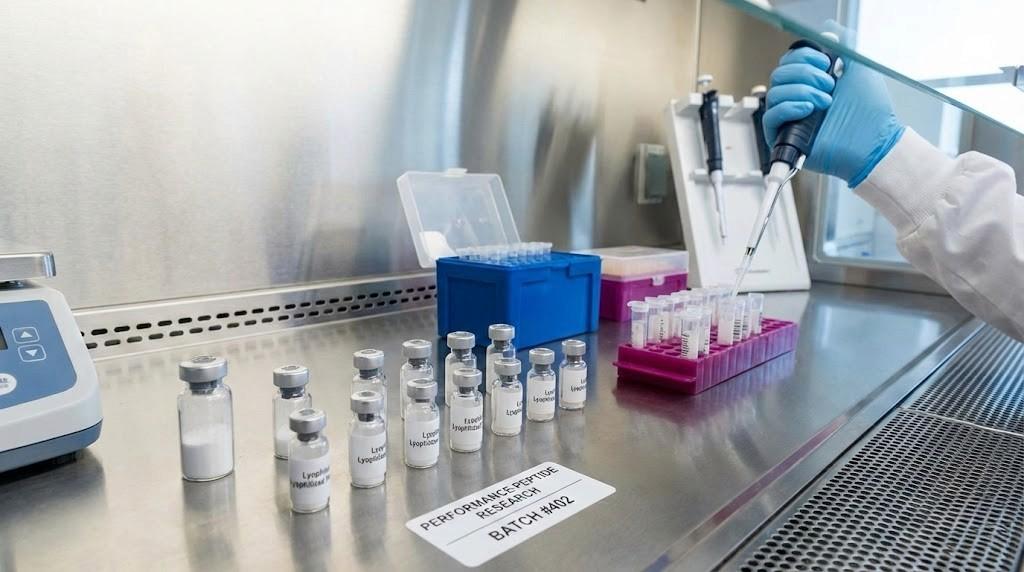
Among the analytical techniques commonly associated with peptide characterization are High-Performance Liquid Chromatography (HPLC) and Mass Spectrometry (MS). Although both techniques can contribute to peptide characterization, they answer different analytical questions. Understanding that difference is important when reviewing peptide testing documentation and interpreting laboratory results.
HPLC is a separation technique that can be used to examine the components present in a sample. During an HPLC analysis, a sample is introduced into a chromatographic system where its components interact differently with the stationary and mobile phases. Because of these differences, the compounds move through the system at different rates and are separated from one another.
The result is typically presented as a chromatogram containing a series of peaks. The location and relative size of these peaks provide information about the components detected during the analysis. For peptide samples, the primary peak may correspond to the intended peptide, while smaller peaks can represent other detectable components.
The percentage associated with HPLC purity is generally calculated from the chromatographic data according to the analytical method being used. A reported purity value can therefore provide useful information about the relative amount of the target component detected in the analysis. However, it is important to understand that an HPLC purity percentage is not the same thing as a complete chemical description of a sample
Mass spectrometry provides a different type of information. Instead of primarily separating compounds, mass spectrometry measures ions according to their mass-to-charge ratio. For peptide analysis, this information can be used to help determine whether the measured molecular mass is consistent with the expected peptide.
This makes mass spectrometry particularly useful when evaluating peptide identity. If the expected molecular mass of a peptide is known, the observed mass can be compared with the expected value. Depending on the analytical method and instrumentation, mass spectrometry can also provide additional information about modifications or related molecular species.
The distinction between HPLC and mass spectrometry is therefore important. HPLC can provide information about the separation and relative composition of detectable components, while mass spectrometry can provide information that helps characterize molecular mass and identity. Neither technique should automatically be treated as a replacement for the other. They provide different pieces of the analytical picture.
Researchers may encounter situations where a peptide has a high reported HPLC purity but still requires additional characterization to establish its identity. Conversely, confirming the expected molecular mass does not necessarily mean that the sample contains no other detectable components. Looking at multiple analytical results together can provide a more complete understanding of the material.
Another important part of peptide testing is the Certificate of Analysis (COA). A COA is a document that records analytical information associated with a particular product or batch. Depending on the laboratory and the material being tested, it may include information such as the product name, lot number, testing date, reported purity, analytical methods, molecular mass, and other specifications.
When reviewing a COA, the lot or batch number deserves particular attention. The purpose of batch identification is to connect the analytical documentation with a specific quantity of material. Without that connection, it becomes more difficult to determine whether a particular report actually corresponds to the sample being evaluated.